The data warehouse can link to data in your Azure storage accounts.
- Create an Azure storage account
- Create a blob container
- Upload data and link to PostHog
Step 1: Create an Azure storage account
Firstly, log into Azure and go to Storage Accounts, then create a storage account by following this Azure guide. In the "Advanced" section, ensure to check "Allow enabling anonymous access on individual containers"

Step 2: Create a blob container
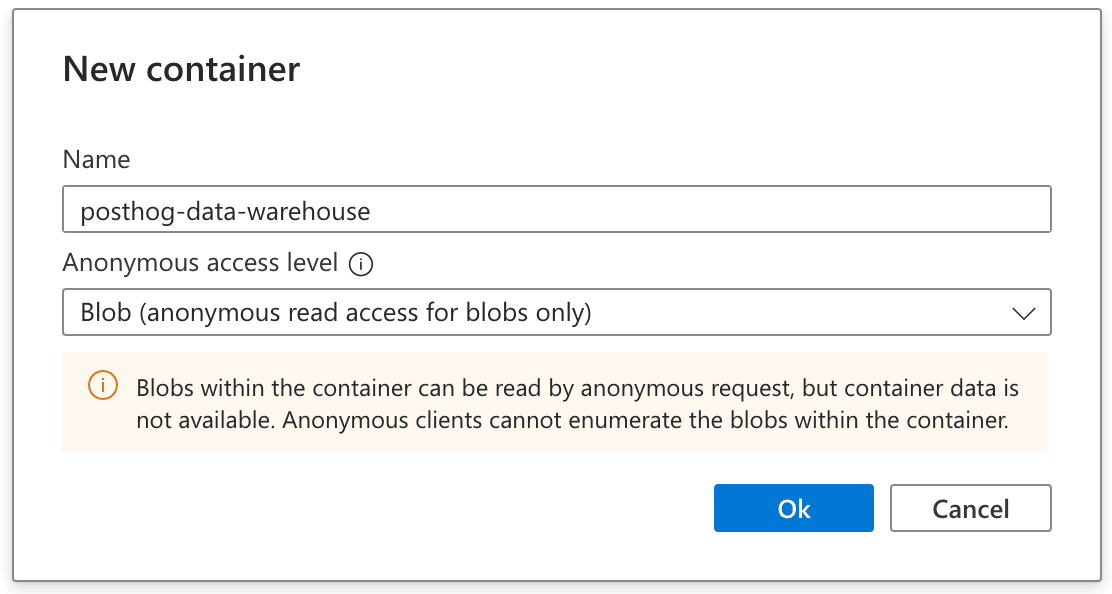
Once the storage account has been created, follow this guide to create a blob container.
When creating the container, ensure you set the "anonymous access level" to Blob (anonymous read access)
Step 3: Upload data and link to PostHog
Upload your data to the newly created container, Parquet files are the recommended format, but PostHog also work with JSON and CSVs too.
Find the newly created file via the storage browser menu item. Once found, open the details and find the URL property - copy this to your clipboard, we'll need it when linking to the file in PostHog.

- On PostHog, open your Data Warehouse tab and hit "Link source" in the top right corner
- Select Azure from the self managed section
- Enter a name for your dataset and paste the copied URL into the "Files URL pattern" box
- Select the correct format for your data
- Enter the storage account name (this is name of the storage account you created in step 1)
- Find and paste your storage account key next - you can use this Azure doc to view your access keys

That's it! You should be able to query the data from the PostHog SQL editor.